While benchmarking a CloudNativePG cluster (PostgreSQL 18.1, one primary and two replicas) on Kubernetes, we raised the per-instance CPU quota from eight to sixteen cores. The rolling reschedule produced a counterintuitive split: primary throughput fell, while read-only replica throughput jumped 35%.
Container metrics showed PostgreSQL consuming only 8.2 cores at peak load. An unsaturated workload cannot gain 35% throughput simply by moving from eight to sixteen cores. Comparing host placement before and after the reschedule explained the illusion right away: the primary had landed on a throttled host while a read replica moved off a throttled host onto a healthy one. Tracing from cpufreq down to model-specific frequency registers (MSR) uncovered two physical hosts idling back to 1.2 GHz and dropping clocks repeatedly under sustained load.
Fixing the benchmark harness before tuning
We ran eight pgbench rounds across two phases: three early exploratory runs labeled R1 to R3 in the tables and charts below, followed by five controlled experiments labeled E1 to E5 after standardizing the harness.
Those first three exploratory runs (R1 to R3) suffered from a flawed methodology: every parameter change ran a fresh pgbench -i initialization followed by a single sample. During an early single-client stability probe against a replica, three runs with identical settings swung across 1,577, 1,676, and 3,531 TPS, a 2.2x spread (excluded from the high-concurrency summary table below). No tuning decision made inside that noise floor holds up.
Starting with the first controlled experiment (E1), we enforced three rules:
- Run
pgbench scale=200once and reuse the exact same persistent dataset across every round. - Warm up
shared_buffersafter every restart, run each scenario twice, and record the median. - Use
pgbench(pure index lookups and updates) strictly for CPU,fsync, and protocol overhead, and test sequential scans separately for storage and asynchronous I/O.
Run-to-run variance immediately tightened to 1% to 3%, making every subsequent delta readable.
Same CPU and microcode, 2.34x slower single-core benchmark
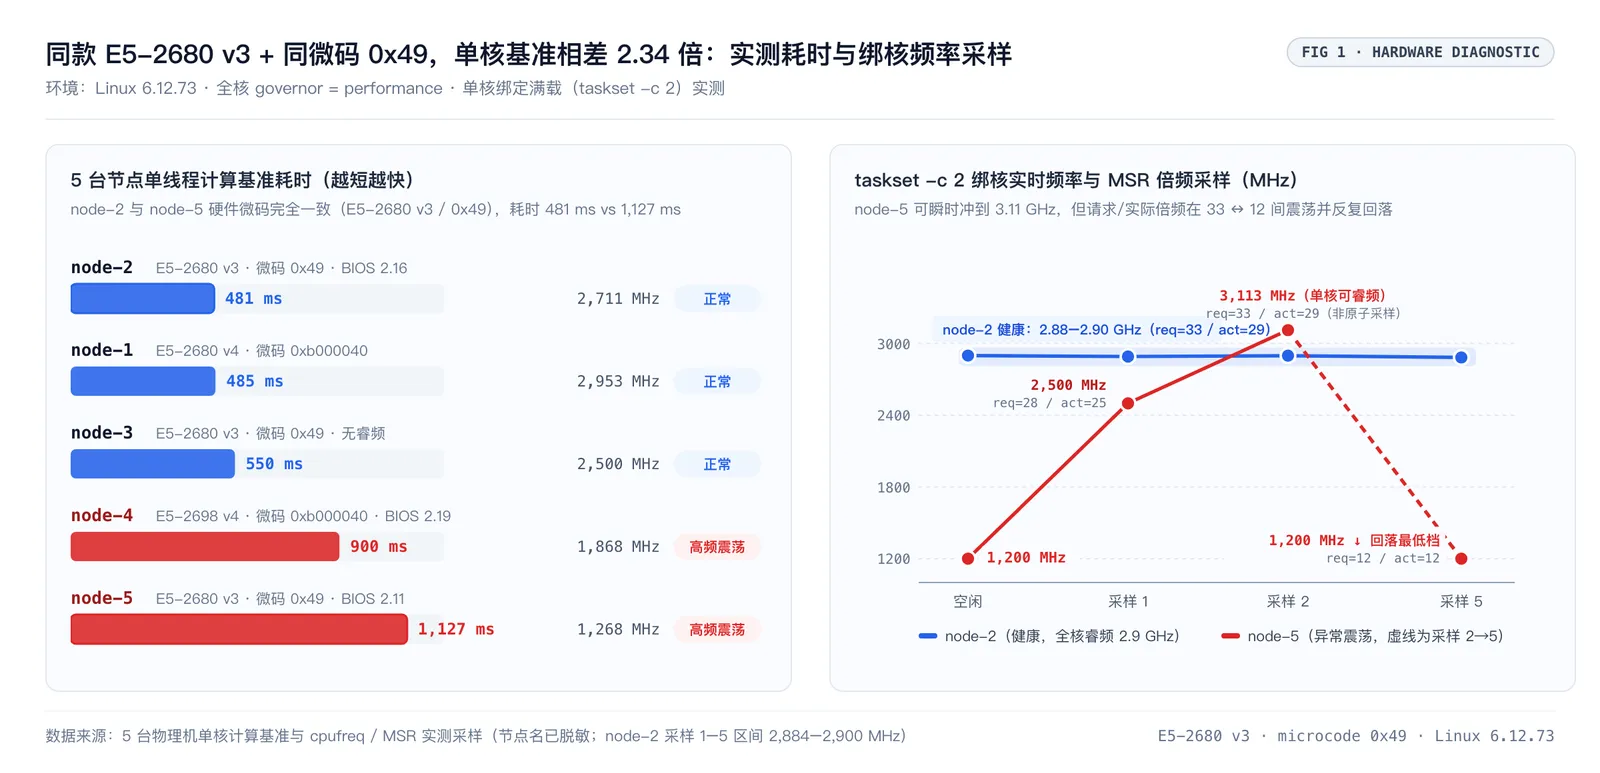
To rule out PostgreSQL and Kubernetes entirely, we ran a single-threaded CPU-only compute benchmark across all five physical nodes and recorded loaded clocks (sorted fastest to slowest below; the loaded frequencies are observations taken during that benchmark and differ slightly in sampling cadence from the pinned-core taskset -c 2 traces later):
| Node (anonymized) | CPU model | Microcode | BIOS version | Single-thread benchmark | Loaded frequency | Status |
|---|---|---|---|---|---|---|
node-2 | E5-2680 v3 | 0x49 | 2.16.0 (2022) | 481 ms | 2,711 MHz | Healthy |
node-1 | E5-2680 v4 | 0xb000040 | - | 485 ms | 2,953 MHz | Healthy |
node-3 | E5-2680 v3 | 0x49 | - | 550 ms | 2,500 MHz | Healthy (base clock, no turbo) |
node-4 | E5-2698 v4 | 0xb000040 | 2.19.0 (2023) | 900 ms | 1,868 MHz | Oscillating |
node-5 | E5-2680 v3 | 0x49 | 2.11.0 (2019) | 1,127 ms | 1,268 MHz | Oscillating |
node-2 and node-5 share the same E5-2680 v3 processor, the same 0x49 microcode, and the same Linux 6.12.73 kernel, yet single-core runtime differed by 2.34x (481 ms vs 1,127 ms).
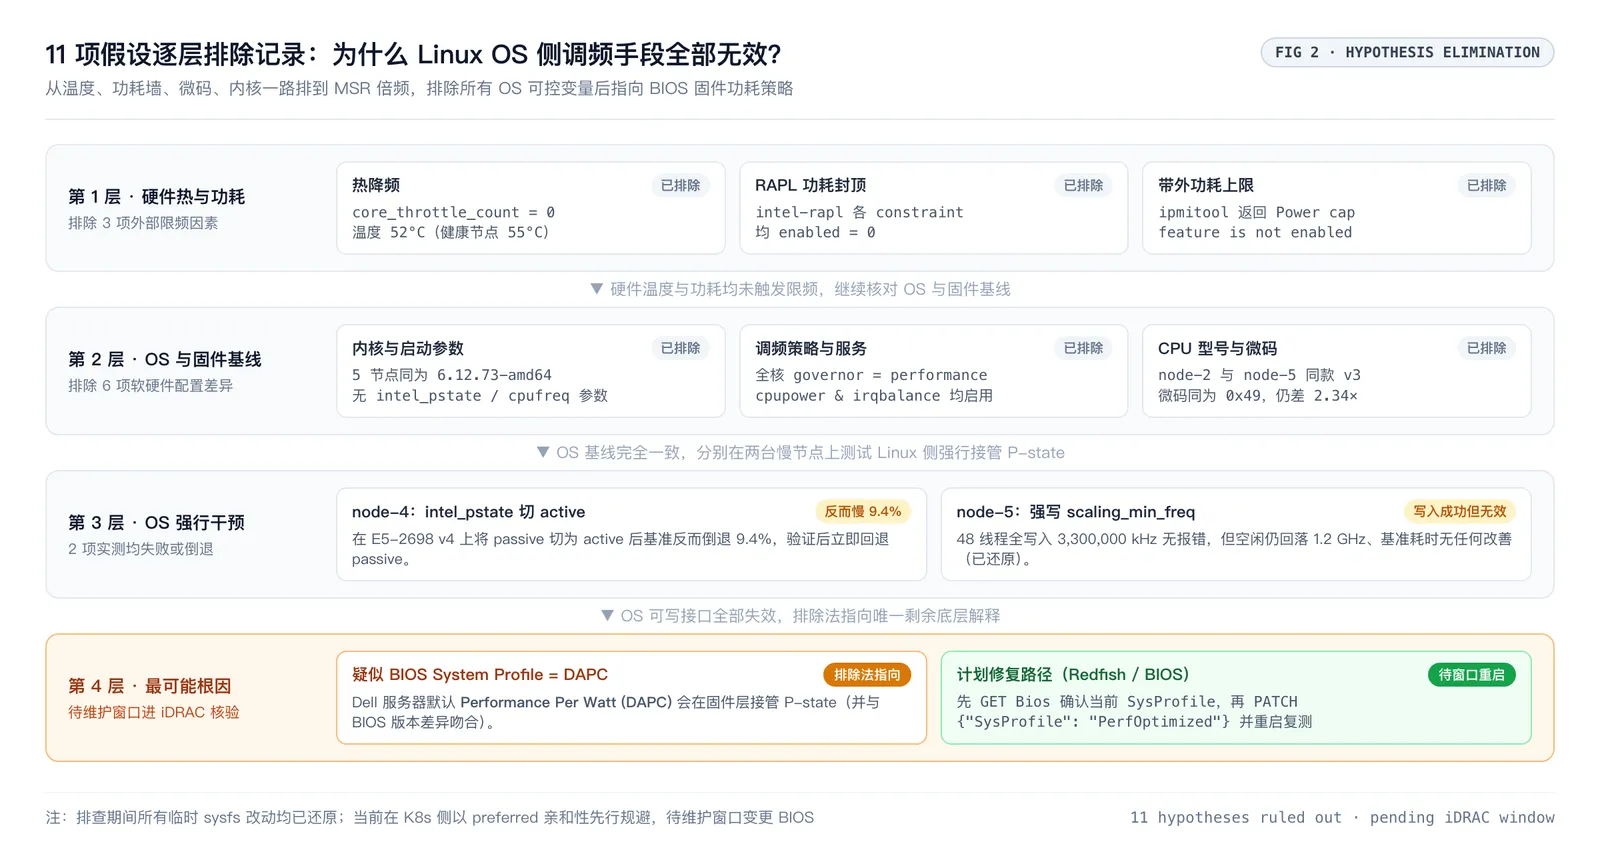
We then ruled out eleven hypotheses across three layers (three hardware thermal and power checks, six OS and firmware baseline checks, and two direct OS overrides, matching the funnel diagram below):
cat /sys/devices/system/cpu/cpu0/thermal_throttle/core_throttle_count
grep -H . /sys/class/powercap/intel-rapl:*/constraint_*_enabled
cat /sys/devices/system/cpu/cpu0/cpufreq/scaling_governor
ipmitool dcmi power reading- Layer 1: Hardware thermals and power (3 ruled out):
- Thermal throttling:
core_throttle_count = 0, and the slow hosts ran cooler (52°C) than the healthy hosts (55°C). - RAPL power limits: every
intel-raplconstraint reportedenabled = 0. - Out-of-band power cap:
ipmitoolreturnedPower cap set feature is not enabled.
- Thermal throttling:
- Layer 2: OS and firmware baseline (6 ruled out):
- All five hosts matched on kernel version (
6.12.73-amd64), boot parameters (nointel_pstate=orcpufreq=overrides), all-coregovernor = performance,cpupower-performance.serviceandirqbalance, plus identical CPU silicon and microcode betweennode-2andnode-5.
- All five hosts matched on kernel version (
- Layer 3: Direct OS overrides (2 ruled out):
- Switching
intel_pstatefrompassivetoactiveonnode-4(E5-2698 v4) slowed the benchmark by 9.4% (reverted immediately). - Writing
3,300,000toscaling_min_freqacross all 48 hardware threads onnode-5succeeded without error, yet idle clocks still dropped to1.2 GHzwith zero runtime improvement (also reverted).
- Switching
Pinning a busy loop to CPU 2 with taskset -c 2 while sampling scaling_cur_freq alongside rdmsr (0x199 IA32_PERF_CTL for requested multiplier and 0x198 IA32_PERF_STATUS for actual hardware multiplier) exposed the underlying behavior:
taskset -c 2 yes > /dev/null &
for i in 1 2 3 4 5; do
  freq=$(cat /sys/devices/system/cpu/cpu2/cpufreq/scaling_cur_freq)
  req=$(( (0x$(rdmsr -p 2 0x199) >> 8) & 0xff ))
  act=$(( (0x$(rdmsr -p 2 0x198) >> 8) & 0xff ))
  echo "sample $i: ${freq} kHz | req=${req} | act=${act}"
  sleep 1
done
Sample output:
# node-5 (throttled host)
idle cpu2 = 1,200,062 kHz
sample 1: 2,499,976 kHz | req=28 | act=25
sample 2: 3,113,208 kHz | req=33 | act=29   # brief single-core turbo burst (non-atomic reads)
sample 5: 1,199,946 kHz | req=12 | act=12   # dropped to minimum P-state while saturated

# node-2 (healthy host)
idle cpu2 = 2,900,021 kHz                   # pinned high even when idle
samples 1-5: 2,883,520 to 2,899,999 kHz | req=33 | act=29
Two hardware details stand out here:
- Healthy
node-2holds a steady requested multiplier of33(3.3 GHz) and an actual multiplier of29(2.9 GHz), which is the all-core turbo bin of an E5-2680 v3 with deep C-States disabled. With deep C-States active,node-5can briefly spike to3.11 GHzon one core, but spends most of its time hovering near1.2 GHzas if runningpowersave. - Seeing
req=12on sample 5 under theperformancegovernor means the OS request itself was clamped, typically because firmware tightenedbios_limitvia ACPI_PPC. We missed inspecting/sys/devices/system/cpu/cpu2/cpufreq/bios_limitduring this pass and will verify it during the next maintenance window.
Once every writable OS interface was ruled out, the most likely root cause is Dell's default BIOS System Profile left on Performance Per Watt (DAPC), which also matches the BIOS version difference across hosts. ipmitool cannot change this option, and because production maintenance windows restrict reboots, we documented the Dell Redfish verification and update path for the scheduled window (on Dell 13G servers, PerfOptimized manages sub-attributes automatically; overriding sub-fields such as ProcCStates individually requires setting SysProfile to Custom):
# 1. Inspect current BIOS attributes to confirm whether SysProfile is DAPC
curl -sk -u <user>:<pass> \
  https://<idrac-host>/redfish/v1/Systems/System.Embedded.1/Bios | jq '.Attributes | {SysProfile, ProcPwrPerf, ProcCStates}'

# 2. Switch to PerfOptimized and schedule a reboot job for the maintenance window
curl -sk -u <user>:<pass> -X PATCH \
  https://<idrac-host>/redfish/v1/Systems/System.Embedded.1/Bios/Settings \
  -H 'Content-Type: application/json' \
  -d '{"Attributes":{"SysProfile":"PerfOptimized"}}'

curl -sk -u <user>:<pass> -X POST \
  https://<idrac-host>/redfish/v1/Managers/iDRAC.Embedded.1/Jobs \
  -H 'Content-Type: application/json' \
  -d '{"TargetSettingsURI":"/redfish/v1/Systems/System.Embedded.1/Bios/Settings"}'
When a cluster co-locates distributed block storage on the same physical hosts, clock throttling hits more than database pods: storage daemon checksumming and encoding paths are single-core sensitive as well, raising write latency across the entire pool.
Eight benchmark rounds: what broke and what held up
Below is the complete eight-round pgbench record (c=32 and c=64 denote concurrent client connections). R1 to R3 are the early exploratory runs before dataset fixation and carry high variance, while E1 to E5 are controlled experiments:
| Round | Phase | Key change | Write c=32 | Write c=64 | Primary read c=32 | Primary read c=64 | Replica read c=64 | Notes |
|---|---|---|---|---|---|---|---|---|
R1 | Unfixed | Initial baseline (max_wal_size=8GB) | 4,318 | 6,219 | 58,429 | 55,915 | 75,619 | High-noise baseline |
R2 | Unfixed | max_wal_size=24GB + zstd + aggressive bgwriter | 4,113 | 6,022 | 55,652 | 55,522 | 74,602 | Major WAL I/O drop, lower low-concurrency reads |
R3 | Unfixed | Reverted bgwriter to defaults | 3,912 | 5,819 | 52,249 | 54,788 | 66,557 | High-noise phase, kept conservative defaults |
E1 | Fixed | Controlled baseline (8 vCPU) | 3,878 | 6,160 | 57,204 | 55,022 | 73,155 | Variance tightened to 1%-3% |
E2 | Fixed | Enabled commit_delay=1700µs | 3,064 | 5,688 | 57,550 | 54,528 | 70,014 | Write c=32 dropped -21%, reverted at once |
E3 | Fixed | Scaled CPU from 8 to 16 cores | - | - | - | - | - | Reschedule moved primary onto slow host; invalidated |
E4 | Fixed | Affinity off slow hosts + 16 vCPU | 3,585 | 5,615 | 52,644 | 55,951 | 98,859 | Replicas +35% from leaving slow hosts |
E5 | Fixed | Scaled CPU back to 12 cores | 3,794 | 5,665 | 51,641 | 52,838 | 95,686 | Matches 16 cores, confirming CPU is not the bottleneck |
Both write and primary read numbers in
E4andE5came in roughly7% to 10%belowE1(for example,51,641vs57,204onc=32primary reads). Checking pod placement explained it:E4andE5placed the primary on non-turbonode-3(2,500 MHz), whereasE1ran onnode-1(2,889 MHzduring that run, roughly a13%clock gap between healthy hosts).
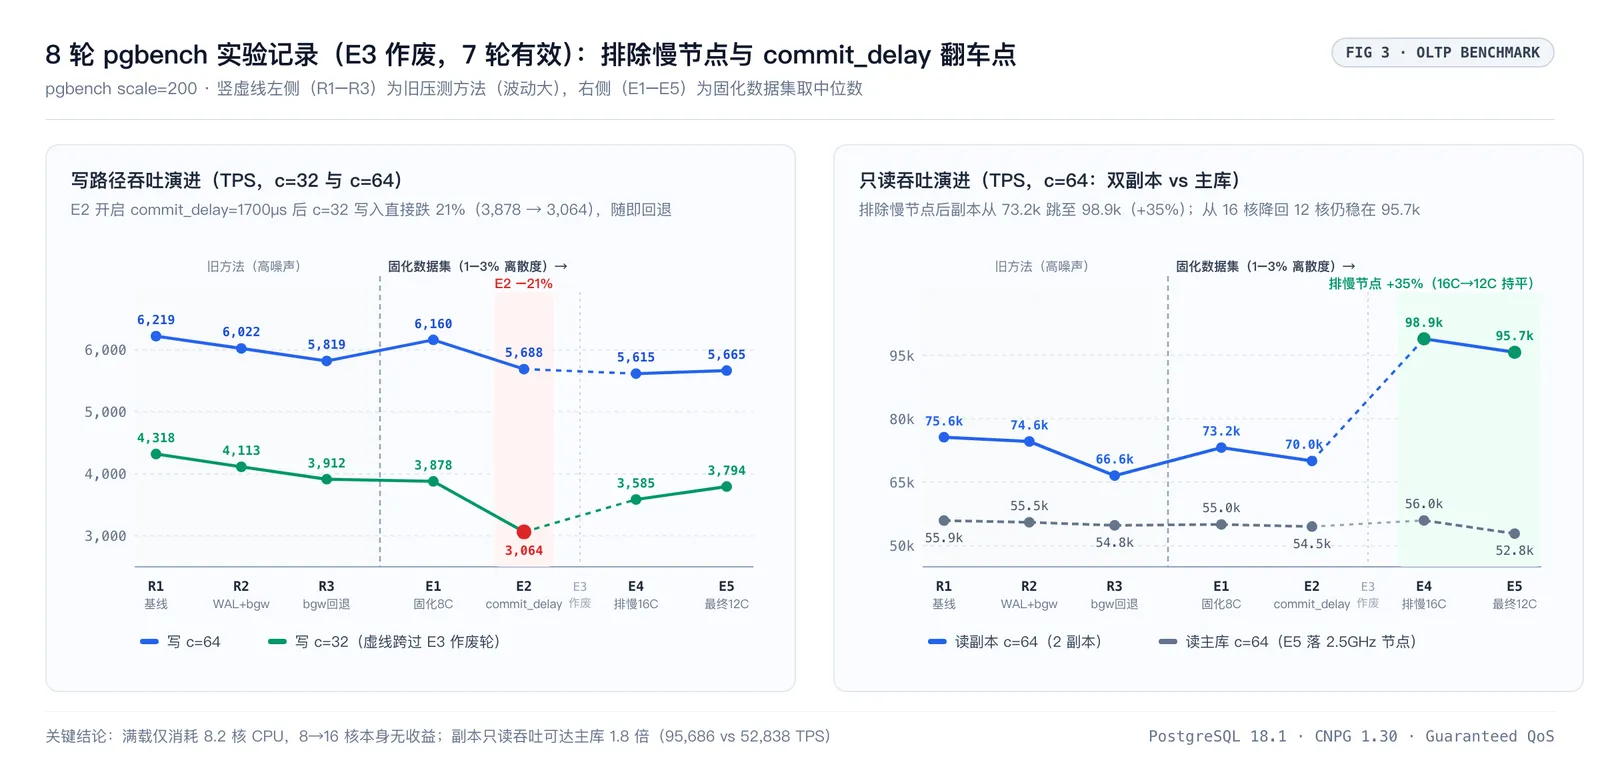
These eight rounds disproved one popular tweak (commit_delay), ruled out two newer features that did not fit the workload (PostgreSQL 18 AIO and HugePages), and left aggressive bgwriter tuning reverted to conservative defaults.
Regression under commit_delay: write throughput dropped 21%
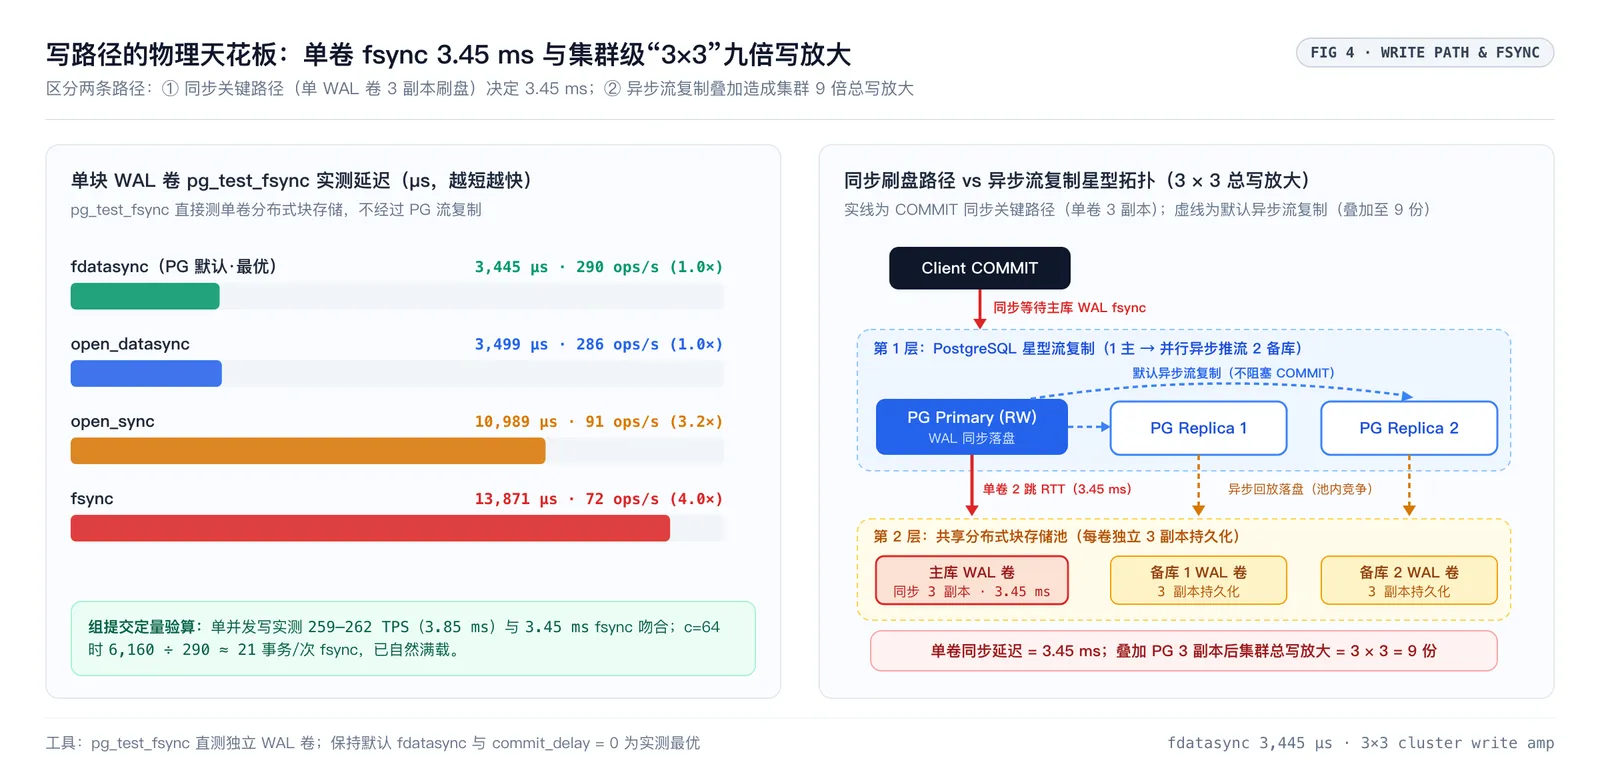
Running pg_test_fsync directly against the separately mounted WAL volume (backed by three-replica distributed block storage) exposed the write floor:
pg_test_fsync -f /var/lib/postgresql/wal/test_fsync.out| Sync method | Average latency | ops/sec | Relative to default |
|---|---|---|---|
fdatasync (PG default) | 3,445 µs | 290 | Fastest |
open_datasync | 3,499 µs | 286 | Tied |
open_sync | 10,989 µs | 91 | 3.2x slower |
fsync | 13,871 µs | 72 | 4.0x slower |
Dividing the measured numbers makes the bottleneck plain:
- Single-client writes measured
259-262 TPS(3.85 msper transaction), matching the3.45 msfdatasyncceiling. Single-client writes are bound directly by volumefsynclatency. - At
c=64, writes reached6,160 TPS. Dividing6,160by290 fsync/sgives roughly21transactions per flush, meaning PostgreSQL was already batching about 21 commits naturally inside each3.45 msflush window.
Adding an extra 1,700 µs commit_delay simply inserted 1.7 ms of artificial wait time, cutting c=32 write throughput by 21%.
It also clarifies the cluster-wide write amplification math: 3.45 ms is the synchronous latency of a single WAL volume committing across three storage replicas plus two storage-network round trips, independent of PostgreSQL streaming replication. Across one primary and two replicas using asynchronous streaming replication, every committed transaction ultimately writes 3 PostgreSQL instances × 3 block-storage replicas = 9 persisted copies. That does not block the primary's asynchronous COMMIT, yet it triples background IOPS contention on the shared storage pool and indirectly raises flush latency.
Skipping PostgreSQL 18 AIO (io_uring) and HugePages
Our container image ships with liburing linked and io_method=io_uring ready to enable, yet testing led us to leave io_method, io_workers, and io_combine_limit at defaults:
- PostgreSQL 18 asynchronous I/O covers sequential scans, bitmap heap scans, and
VACUUM, not index point lookups. Becausepgbenchruns entirely through indexes, AIO cannot help it. - The active working set fits comfortably inside
4 GBofshared_buffers. Even when we built an11 GBtable specifically to force sequential storage reads, the second and third scans served straight from the container's Linux page cache (1.8 swall time, only154 msin actual read I/O, effectively measuring6 GB/sof memory bandwidth).
We also left HugePages disabled because each host reserved only 2 GiB, which is smaller than our 4 GB shared_buffers.
As for the aggressive bgwriter settings tried during exploratory run R2, the noisy early harness (and noisy R3 revert in the table above) prevents calling it a strict falsification, yet low-concurrency reads did dip 13% to 19% with no write gain, so we kept PostgreSQL defaults (bgwriter_delay=200ms, lru_maxpages=100, lru_multiplier=2.0).
Three changes that delivered measurable gains
Raising max_wal_size from 8 GB to 24 GB with zstd WAL compression
The initial baseline (R1) used max_wal_size = 8GB, which filled up continuously during benchmarks, firing 30 forced WAL checkpoints and triggering heavy Full Page Writes (FPW). Raising max_wal_size to 24 GB and turning on wal_compression = zstd cut write I/O sharply under the same load:
- Forced WAL checkpoints:
30→0 - Full Page Writes (FPW):
162,579→47,898(-70.5%) - Total WAL generated under identical writes:
5,934 MB→2,614 MB(-56%), driven by both eliminated checkpoint FPW andzstdcompression
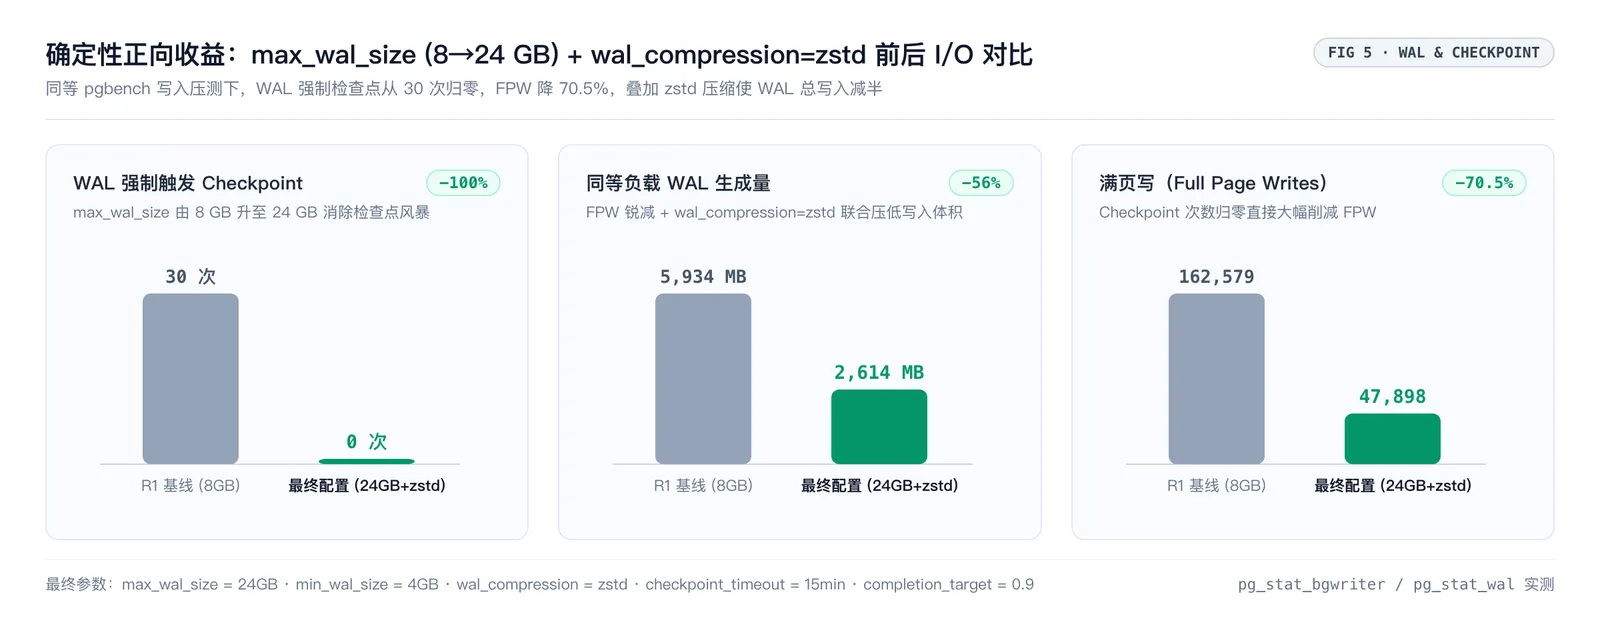
Mapping the 66k TPS single-instance read plateau with prepared statements
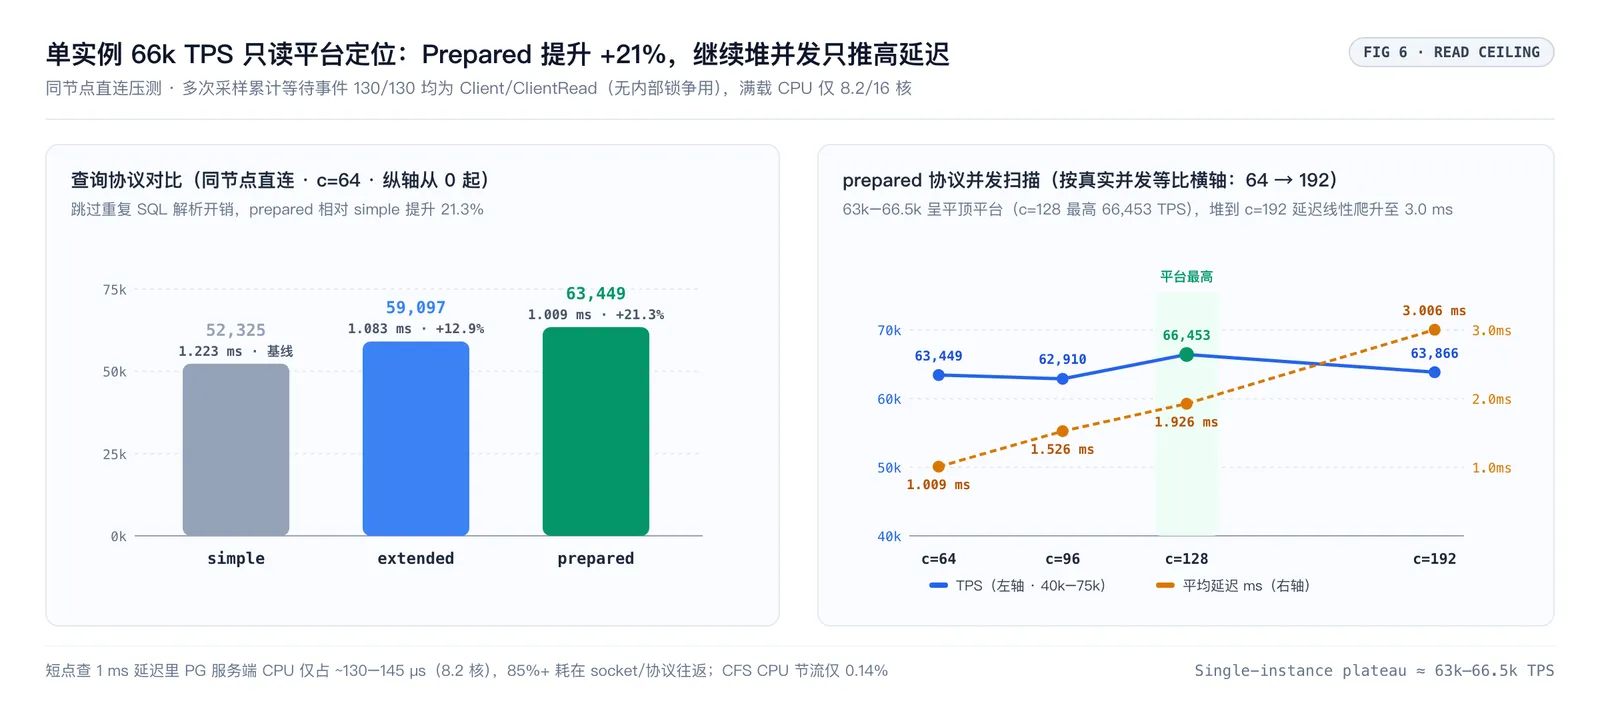
Even under maximum read pressure, a single container used only 8.2 of 16 vCPUs while plateauing around 50k to 60k TPS. Checking four suspects in turn ruled out server saturation:
- CFS CPU throttling: only
10throttled periods out of7,059(0.14%). - Cross-node networking: same-node direct reads hit
62,376 TPSvs56,463 TPSacross nodes, placing cross-node network overhead at about10%. - Internal lock contention: repeated snapshots of active sessions showed
130 / 130waits onClient/ClientRead, with zero internal lock queuing.
SELECT wait_event_type, wait_event, count(*)
FROM pg_stat_activity
WHERE state = 'active' AND pid <> pg_backend_pid()
GROUP BY 1, 2
ORDER BY 3 DESC;- Client generator headroom: the exact same load generator pushed
98,859 TPSacross two replicas simultaneously, proving the client was not capped.
Comparing all three pgbench query protocol modes (-M simple, extended, and prepared) over same-node direct connections at c=64 revealed the gap:
pgbench -h <pod-ip> -U postgres -S -c 64 -j 16 -T 60 -M prepared pgbench| Protocol mode | TPS | Average latency | vs simple |
|---|---|---|---|
simple | 52,325 | 1.223 ms | Baseline |
extended | 59,097 | 1.083 ms | +12.9% |
prepared | 63,449 | 1.009 ms | +21.3% |
Switching to prepared bypassed repeated SQL parsing for a +21.3% lift (extended still sends Parse each time, yet skips text escaping and saves protocol overhead for +12.9%). Sweeping concurrency under prepared:
c=64:63,449 TPS(1.009 ms)c=96:62,910 TPS(1.526 ms)c=128:66,453 TPS(1.926 ms)c=192:63,866 TPS(3.006 ms)
Throughput flattened into a 63k-66.5k TPS ceiling, beyond which extra concurrency only added linear latency. Dividing 8.2 cores across 56k-62k TPS puts server-side CPU cost at roughly 130-145 µs per point lookup, meaning more than 85% of the 1 ms round trip goes to socket transit and scheduling for ultra-short queries. That matches the 130/130 Client/ClientRead observations and let us settle per-instance CPU limits at 12 cores (8.2 peak cores plus system process headroom).
Read-write splitting (-rw to -ro) and fixing a Kubernetes affinity deadlock
CloudNativePG automatically creates a read-write Service (<cluster>-rw) and a read-only Service (<cluster>-ro). Two read-only replicas delivered 95,686 TPS (1.8x the primary), whereas application traffic had previously pointed everything at -rw. Routing read-only queries to -ro was the largest immediate capacity win.
While steering pods away from the throttled hosts, we also caught a self-inflicted availability trap. Combining podAntiAffinity: required (all three instances must land on distinct hosts) with nodeAffinity: required (restricting pods to the three healthy hosts) locks three pods onto exactly three machines: if any single healthy host fails, the replacement pod stays stuck in Pending indefinitely.
Downgrading nodeAffinity to preferred (weight 100) resolved the deadlock:
affinity:
    enablePodAntiAffinity: true
    topologyKey: kubernetes.io/hostname
    podAntiAffinityType: required
    nodeAffinity:
        preferredDuringSchedulingIgnoredDuringExecution: # required -> preferred to avoid indefinite Pending on host loss
            - weight: 100
              preference:
                  matchExpressions:
                      - key: kubernetes.io/hostname
                        operator: In
                        values: [node-1, node-2, node-3]
Under normal operation, instances stay on the three full-clock hosts; if one fails, Kubernetes can temporarily schedule onto a slower host to preserve cluster availability.
Current production parameters and next steps
Sanitized production settings (CloudNativePG 1.30, PostgreSQL 18.1, Guaranteed QoS):
spec:
    instances: 3
    resources:
        requests: { cpu: '12', memory: 16Gi } # 8.2 cores measured at peak, 12 cores for system process headroom
        limits: { cpu: '12', memory: 16Gi }
    postgresql:
        parameters:
            max_connections: '500'
            shared_buffers: '4GB'
            effective_cache_size: '12GB'
            work_mem: '16MB'
            maintenance_work_mem: '1GB'
            max_wal_size: '24GB' # raised from 8GB to eliminate forced WAL checkpoints
            min_wal_size: '4GB'
            wal_compression: 'zstd' # cuts total WAL writes by 56% alongside fewer FPW
            checkpoint_completion_target: '0.9'
            checkpoint_timeout: '15min'
            commit_delay: '0' # enabling regressed writes by 21%
            random_page_cost: '1.1'
            effective_io_concurrency: '200'
            bgwriter_delay: '200ms' # kept at default
            bgwriter_lru_maxpages: '100'
            bgwriter_lru_multiplier: '2.0'
For now, preferred node affinity keeps database pods off the two throttling hosts. During the next data-center maintenance window with iDRAC access, we will inspect bios_limit and BIOS SysProfile, switch both hosts to PerfOptimized across a reboot, re-run single-core clock and distributed-storage fsync benchmarks, and remove the nodeAffinity block altogether.
References
- Tuning AIO in PostgreSQL 18, Tomas Vondra
- Benchmarking Postgres 17 vs 18, PlanetScale
- Waiting for Postgres 18: Accelerating Disk Reads with Asynchronous I/O, pganalyze
These notes come from day-to-day maintenance of our public cloud and model inference infrastructure. If you maintain an open-source project (especially AI agents, MCP tooling, or self-hosted software) and need hourly cloud servers for demos or DeepSeek and model API credits for testing, try the Leaflow Console or reach out via our About page.